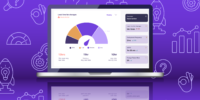
Ahoy, DevOps navigators! In the fast-paced seas of software development and operations, a reliable DevOps dashboard is your compass, steering you through the dynamic currents of code deployments, infrastructure changes, and system health. Let’s embark on a journey to master the art of DevOps dashboard dynamics with quick tips that will keep your ship sailing smoothly and your crew well-informed.
The DevOps Seascape: Charting Your Dashboard Waters ️
Begin your voyage by charting the DevOps seascape. Identify key performance indicators (KPIs) and metrics relevant to your applications and infrastructure. From deployment frequency to error rates, a clear understanding of your dashboard waters ensures that you navigate with purpose and efficiency.
Real-time Visibility: Sailing with the Winds of Instant Insights ⏰
Sail with the winds of instant insights by ensuring real-time visibility on your DevOps dashboard. A dynamic environment demands real-time monitoring to detect anomalies, performance bottlenecks, and potential issues as they occur. Swift and proactive responses are the sails that harness the power of real-time visibility.
Customized Widgets: Tailoring Your Dashboard Canvas
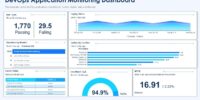
Tailor your dashboard canvas with customized widgets that provide a snapshot of critical information. From deployment status to resource utilization, choose widgets that align with your team’s objectives. A well-crafted dashboard is your artistic palette, allowing you to visualize the DevOps masterpiece in progress.
Automated Alerts: Sounding the Alarm on DevOps High Seas
Sound the alarm on the DevOps high seas with automated alerts. Set up alerts based on predefined thresholds for key metrics. Whether it’s response time exceeding limits or an unexpected spike in errors, automated alerts act as the lighthouse, warning your team of potential storms before they escalate.
Collaborative Dashboards: Navigating with Team Synergy
Navigate with team synergy by adopting collaborative dashboards. Encourage cross-functional teams to contribute and customize their view of the dashboard. Collaborative dashboards promote transparency, shared responsibility, and a collective effort to keep the ship sailing smoothly through the ever-changing DevOps currents.
Historical Data Analysis: Learning from the DevOps Past
Learn from the DevOps past by analyzing historical data on your dashboard. Dive into trends and patterns to gain insights into system performance, user behavior, and the impact of changes over time. Historical data analysis is your compass, guiding future decisions and optimizations.
Integration with CI/CD Tools: Smooth Sailing from Code to Deployment
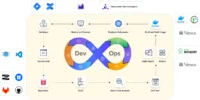
Ensure smooth sailing from code to deployment by integrating your dashboard with CI/CD tools. Connect your dashboard to your continuous integration and continuous deployment pipelines. This integration provides a seamless flow of information, from code changes to deployment status, enabling your team to monitor the entire lifecycle in one central location.
Security Monitoring: Guarding Against DevOps Pirates ☠️
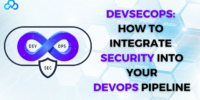
Guard against DevOps pirates by incorporating security monitoring into your dashboard. Keep an eye on security-related metrics, vulnerability scans, and threat intelligence. A secure DevOps dashboard acts as your fortress, protecting your ship and crew from potential cyber threats on the high seas.
User Experience Metrics: Steering Towards User Satisfaction
Steer towards user satisfaction by including user experience metrics on your dashboard. Monitor metrics such as page load times, error rates, and user interactions. A user-centric approach ensures that your team remains focused on delivering a smooth and delightful experience for those navigating the seas of your applications.
Continuous Dashboard Improvement: Navigating the Waters of Enhancement
Navigate the waters of enhancement with a mindset of continuous dashboard improvement. Regularly gather feedback from your team, evaluate the effectiveness of the dashboard, and iterate on its design and content. Continuous improvement is the compass that guides your dashboard towards excellence.
Conclusion: Sailing into DevOps Success
As you embark on the journey of DevOps dashboard dynamics, remember that your dashboard is not just a tool; it’s the helm of your DevOps ship. By charting your dashboard waters, ensuring real-time visibility, customizing widgets, setting up automated alerts, promoting collaborative dashboards, analyzing historical data, integrating with CI/CD tools, incorporating security monitoring, focusing on user experience metrics, and committing to continuous improvement, you’re not just sailing; you’re navigating into the realm of DevOps success. May your dashboard always guide you towards efficient and delightful DevOps adventures!

