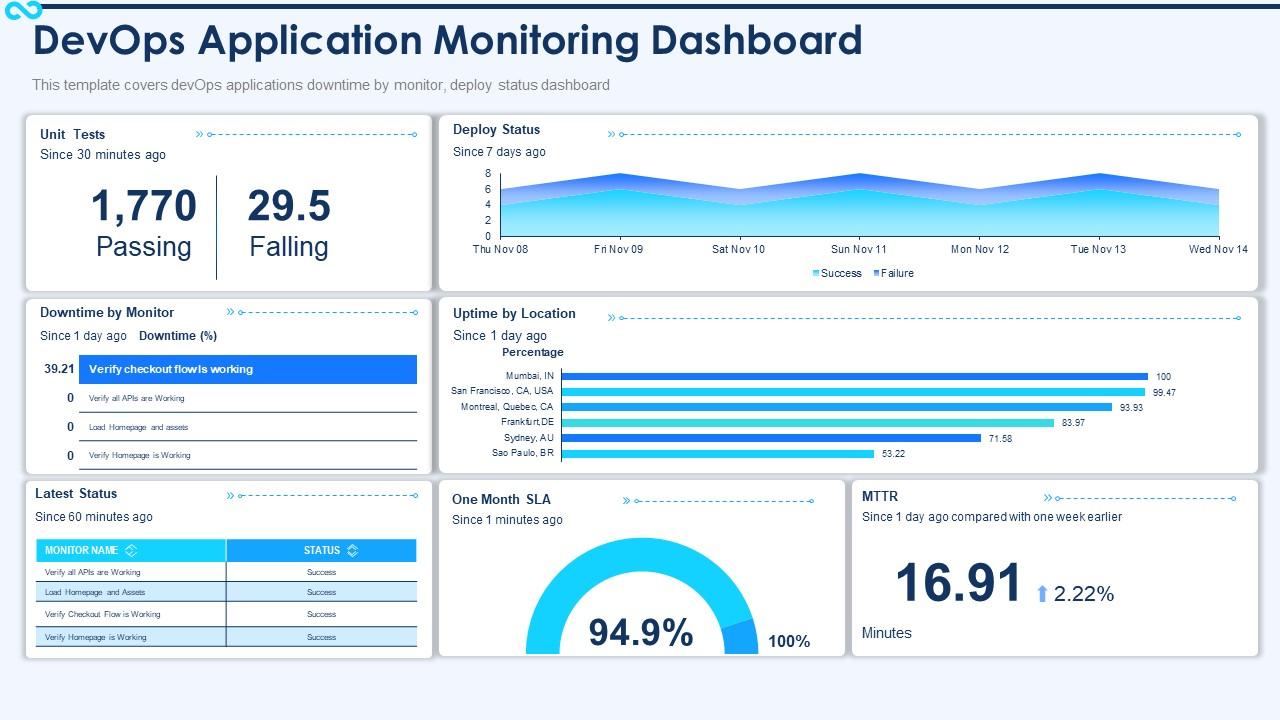
Welcome to the realm of DevOps Dashboard Design, where the art of effective monitoring transforms complex data into actionable insights. In this article, we’ll explore quick tips to master the craft of designing DevOps dashboards that empower your teams to monitor, analyze, and optimize their workflows with precision.
The Significance of DevOps Dashboards: A Window into Operational Excellence
DevOps dashboards serve as the eyes of your operation, providing a visual representation of critical metrics, trends, and performance indicators. Before we delve into the tips, let’s understand the significance of DevOps dashboards and their role in achieving operational excellence.
Quick Tips for Effective DevOps Dashboard Design
5. Define Clear Objectives: Kickstart your dashboard design by defining clear objectives. Understand the key metrics that matter to your team and organization. Whether it’s deployment frequency, error rates, or response times, clarity on objectives ensures focused and relevant dashboard content.
4. Embrace Simplicity and Consistency: Enchant your dashboard with the principles of simplicity and consistency. Avoid information overload by presenting only essential metrics. Use consistent color schemes, icons, and layouts across different dashboards for a cohesive and user-friendly experience.
3. Prioritize Real-time Visibility: Infuse your dashboard with real-time visibility. Leverage live updates and real-time data feeds to ensure your team has instant access to the latest information. Real-time visibility empowers quick decision-making and enhances responsiveness to changes. ️
2. Customize for Different Audiences: Empower diverse teams with tailored dashboards. Customize views for different audiences, such as developers, operations, and leadership. A tailored approach ensures that each team can focus on the metrics most relevant to their responsibilities and goals.
1. Enable Interactivity: The heart of effective monitoring lies in interactivity. Design dashboards that allow users to drill down into specific metrics, explore trends, and gain deeper insights. Interactive elements enhance user engagement and facilitate thorough analysis.
The Inverted Pyramid Approach: Ascending to Monitoring Excellence ️
Ascending to monitoring excellence through DevOps Dashboard Design follows the inverted pyramid approach. Start with defining clear objectives, embrace simplicity and consistency, prioritize real-time visibility, customize for different audiences, and enable interactivity. The journey to effective monitoring is a step-by-step ascent to operational mastery.
Empower Your Teams: Design with Insight, Monitor with Precision!
In conclusion, DevOps Dashboard Design is not just about aesthetics; it’s about empowering your teams with the insights they need to drive operational excellence. By incorporating these quick tips, you’re not just designing dashboards; you’re crafting a window into the heartbeat of your DevOps processes. May your dashboards be insightful, your monitoring be precise, and your operational journey be marked by continuous improvement! ️


